Share this
by Henry Chapman on May 23, 2023
A comparative social intelligence analysis of past and current debt ceiling debacles
Debt ceiling crises present recurring challenges for the United States government as they limit the government's borrowing capacity to cover its expenses. Over the past decade, these crises have become more frequent, coinciding with the increasing partisanship in Washington, DC.
To comprehensively understand the issues around the debt ceiling, we conducted a comparative social listening analysis of the last debt ceiling crisis (2011) and the current situation in 2023. We looked at Entities, Interests, post volume, sentiment, and Emotions metrics. Here we go through our findings. Spoiler alert: Infegy Atlas data shows striking similarities between how both unfolded. By studying these patterns and dynamics across both situations, we can deepen our understanding of the underlying factors related to debt ceiling crises and predict how similar future problems will unfold.
What is the debt ceiling crisis?
The debt ceiling is a limit set by the government on how much money it can borrow to cover its expenses. It's like a financial cap or maximum borrowing limit. When the government spends more money than it collects in taxes, it needs to borrow money to make the difference. By reaching the debt ceiling, our government is legally not allowed to borrow any more money, even if it needs to pay its bills and fulfill its financial obligations.
Our inability to raise the debt ceiling could mean delayed payments to Social Security recipients, military service members, and anyone else who works for the government. Moreover, failing to raise the debt ceiling could have severe consequences for the world economy. It could undermine investor confidence, increase interest rates, and make it more expensive for the government to borrow money in the future. Frustratingly, these debt ceiling crises have gotten more frequent in the last decade, corresponding with the increase in partisanship in Washington, DC.
Comparing the 2011 debt ceiling crisis versus the 2023 debt ceiling crisis
Infegy Atlas Entities
In 2011, the US government faced similar challenges relating to the shifting power dynamics in Washington DC. Former Democratic President Barack Obama faced an upcoming election in 2012 and an insurgent right-wing Republican Party led by John Boehner, who was buoyed by the (previously powerful) Tea Party movement. The Tea Party members were elected as Republicans on a 2010 mandate to lower government spending and taxes. It's no surprise that Obama and Boehner were the top Entities related to the 2011 debt ceiling.
A significant fallout of the 2011 debt ceiling crisis was that the S&P Global Rating for the US dropped, causing massive financial turmoil. S&P shows up as a prominent Entity with over 49.1k posts and only 18% positivity.

Figure 1: Entities table for 2011 debt ceiling crisis; Infegy Atlas data.
Similar to the situation in 2011, In 2023, the Democrat-led government faces an insurgent right-wing faction of the GOP. Instead of the Tea Party, we have Trump-influenced MAGA Republicans. Many of the debt ceiling complaints originate from the House Freedom Caucus, the farthest-most right wing of the Republican Party. Once again, points of contention center around taxes. For example, 2023 negotiations are aimed at curbing the Inflation Reduction Act, which increased IRS funding by $80 billion. Republicans strongly oppose this for two reasons: a desire for lower taxes and to limit the IRS's investigative powers (historically, the IRS has been aggressive in scrutinizing conservative groups).

Figure 2: Entities table for 2023 debt ceiling crisis; Infegy Atlas data.
Infegy Atlas Interests
Next, we'll take a look at Interests. Infegy Interests identify the other topics about which authors (the ones posting about the topic at hand) discuss. In 2011, during the debt ceiling crisis, healthcare emerged as the prominent issue of the day. President Obama signed the Affordable Care Act (ACA) in 2010, but it remained a contentious sticking point for Republicans into 2011 and beyond.

Figure 3: Interests table for 2011 debt ceiling crisis; Infegy Atlas data.
Fast forward to 2023, and the political landscape has seen a shift in the flavors of critical issues. Elections, crime, and border security have become prominent talking points for Republicans, which explains why crime and elections appear as a potential Interest among those discussing the debt ceiling. These evolving Interests reflect the changing priorities and concerns within the political landscape over time.

Figure 4: Interests table for 2023 debt ceiling crisis; Infegy Atlas data.
Infegy social intelligence shows matched post volume
Figure 5 illustrates the 2011 debt ceiling post volume in blue and the 2023 debt ceiling post volume in red, with the x-axis representing the specific numerical day of the year. This visual representation allows for a direct comparison of how the two crises evolved.
In both 2011 and 2023, there was a noticeable spike in post volume at the beginning of the year, driven by the awareness of the upcoming debt ceiling fight. However, post volume subsequently dropped until approaching the deadline. Furthermore, in both years, we see similar trends leading up to August 2, 2011 (Day 214) and June 5, 2023 (Day 156), respectively. This pattern suggests that social media and public attention significantly increase as the deadlines draw near, underscoring the heightened interest and engagement during these critical periods.

Figure 5: Comparative debt ceiling post volume from 2011 versus 2023; Infegy Atlas data.
Infegy Atlas' sentiment analysis
Now, let's delve into the tone of the conversation surrounding the debt ceiling battles. First, we'll examine the overall amplitude of positive and negative sentiment, focusing on the numbers of positive and negative posts rather than just their distributions.
To visualize the data, we'll use a similar approach as we did with post volume. The 2011 debt ceiling conversation is represented by light green and light red for positive and negative discussions. We display the 2023 conversations with darker shades of red and green.
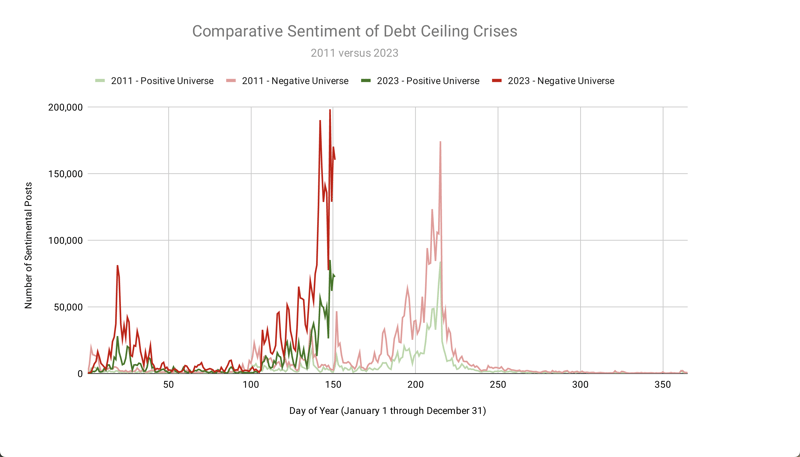
Figure 6: Comparative debt ceiling sentiment from 2011 versus 2023; Infegy Atlas data.
Analyzing this chart, we can observe the general level of negative sentiment expressed by Americans across the political spectrum regarding the debt ceiling. Interestingly, in 2011, as Congress reached a deal (Day 214), the number of positive posts surged, while the number of negative posts dropped. We expect a similar trend in 2023 once the crisis is resolved around June 5 (Day 156), with negative sentiment rapidly cratering.
Infegy Emotions metrics
According to Infegy Emotions analysis, the predominant emotions associated with these debt ceiling fights are Anger and Anticipation. Social media users frequently express anger due to the increasing frustration among Americans with the partisan conflicts and disagreements surrounding these discussions. Conversely, Anticipation often emerges due to the deadline-driven nature of the conversation, as people eagerly anticipate the resolution of the issue.

Figure 7: Comparative debt ceiling Anger and Anticipation from 2011 versus 2023; Infegy Atlas data.
Notably, these emotions closely track each other, indicating a correlation between Anger and Anticipation in the context of the debt ceiling debates. However, in 2023, we observed particularly intriguing trends. As President Biden and Leader McCarthy announced a deal in the last few days, Anticipation soared among the public. However, as both sides finalized the deal's terms, Anger surged, primarily from hard-right members of the Freedom Caucus. They expressed frustration, believing McCarthy did not fight vigorously enough to secure a more favorable deal that extracted even more concessions from Democrats. Infegy Atlas's social intelligence can track the complex interplay of emotions and political dynamics within the context of the debt ceiling discussions.
Predicting outcomes with past events
This analysis compared the 2011 debt ceiling crisis with the 2023 debt ceiling crisis. We revealed deep similarities in post volume, sentiment, and emotions between the two debacles. Using social intelligence around critical political events provides vital data for predicting future outcomes. By studying these patterns and dynamics, we can enhance our ability to navigate and anticipate the complexities of future debt ceiling debates.
Understanding Debt Ceiling Challenges
The U.S. faces recurrent debt ceiling crises, limiting government borrowing. These crises have become frequent due to rising political partisanship.
Debt Ceiling Definition
The debt ceiling restricts government borrowing, leading to potential payment delays and global economic impacts if not raised.
Comparing 2011 and 2023 Debt Ceiling Events
Both 2011 and 2023 crises involve Democrat-led governments facing right-wing GOP factions focused on tax reductions and limiting the IRS.
Shifts in Political Interests
In 2011, healthcare dominated political discussions. By 2023, the focus shifted to elections, crime, and border security among Republicans.
Social Media Post Volume Trends
Debt ceiling post volumes spiked early and closer to deadlines in both 2011 and 2023, showing heightened public interest.
Public Sentiment Analysis
Negative sentiment marked debt ceiling discussions. Positive posts increased as resolutions neared, as seen in past patterns.
Emotional Insight: Anger and Anticipation
Anger and anticipation from social media reflect public frustration and eagerness during debt ceiling negotiations.
Learning from History
Analyzing past debt ceiling events helps predict future outcomes, offering strategic insights into political dynamics.


.png?width=64&height=64&name=linkedin%20(1).png)