Share this
by Henry Chapman on December 2, 2022
Using social media intelligence to monitor conflict-zone momentum
Social media intelligence tools, like Infegy Atlas, analyze and aggregate individual posts – including video descriptions and publicly shared author bios – to generate overarching narratives around a subject.
While Infegy Atlas has primarily been used as a consumer intelligence tool, in this brief, we show how its robust data gathering, analysis, and clustering functions can be used to monitor the momentum around conflict zones. We’ll examine how post volume, Entity detection, and sentiment can provide conflict analysts with real-time data of how the Russian-Ukrainian War of 2022 is unfolding.
After Russian President Vladimir Putin invaded Ukraine in February 2022, Ukrainian and Russian people took to Twitter, VK.com, and TikTok, to post about the war online. They posted commentary and took pictures of the minutiae of troop movements, tanks, and helicopters.
Social media’s immediacy means those posts serve as a real-time pulse to what’s happening in a war zone.
If Vietnam was the first televised war, then the Russian-Ukrainian War of 2022 is becoming the first “TikTok viral” war, where anyone in the world can view real time updates and images from the victims of war themselves.
Using post volume to show a conflict’s momentum
Post volume acts as a proxy for interest in a particular topic. For example, on Election Day, post volume around voting surges. In the world of conflict zones, Infegy Atlas can show how often people post about a particular city. This measure of interest works both over decades and days.
The chart below shows post volume for the term “Ukraine” over the last 16 years. That initial spike shows the Euromaidan protests in 2014 where Ukrainian citizens toppled Putin-backed Ukrainian President Viktor Yanukovych. Next, Ukraine post volume spiked again in 2019 with the election of Ukrainian President Volodymyr Zelenskyy. Finally, Ukrainian post volume surged in February and March of 2019 when Putin launched his ground offensive.
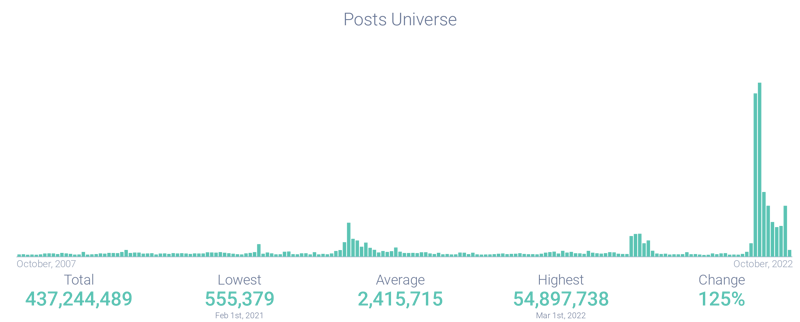
Figure 1: Post volume graph for “Ukraine” over the last 15 years; Infegy Atlas Data.
Post volume showing troop momentum
In the chart below, we’re showing one year of post volume related to Kherson and Izyum, two strategically important Ukrainian cities. Kherson is located in the south of the country, while Izyum is located in the north. Ukraine feinted an offensive towards Kherson all summer, but secretly amassed troops to retake Izyum in the north. The success of that offensive corresponds with the peak in post volume on Izyum. Since that offensive, Ukraine has shifted it’s attention to Kherson in the south, and successfully retook the city after months of fighting. Kherson’s post volume has surged as a result.

Figure 2: Graph comparing Kherson and Izyum related post volume over 2022; Infegy Atlas data.
Using Entity detection to identify weapons systems
Infegy Atlas’ Entity Search detects hundreds of prebuilt Entities on people, places, and significant items – including weapon systems. Using this function, we’re able to see which weapons systems appear most frequently within posts about a particular Ukranian city. The chart below shows how how MGM-140s and M142 HIMARS, two US-made multiple launch rocket systems (MLRS), have been posted about thousands of times in the context of the Ukrainian-led offensive to re-take Kherson.

Figure 3: Infegy Atlas Entity table showing frequency of weapons posts in the context of a Kherson search; Infegy Atlas data.
Using Entity detection to identify Russian leadership
Entity detection not only works with identifying weapons systems, but also helps identify post volume attached to Russian leaders. Below is a comparative word cloud showing trending hashtags attached with Sergey Shoygu (Russian Minister of Defense), Ramzan Kadyrov (Russia-backed leader of Chechnya), and Yevgeny Prigozhin (Russian Oligarch and Leader of the Wagner Group). Entity detection is language-agnostic, so Infegy Atlas can identify posts in Russian, Ukrainian, and Chechen to give analysts a complete picture of the conversation around these people.

Figure 4: Infegy Atlas word cloud showing top hashtags associated with Russian war leadership; Infegy Atlas data.
Using query alerts as real-time notifications
Events change quickly in conflict zones. Infegy Atlas can send analysts and researchers Query Alerts, so they can keep abreast of rapidly changing conditions. For example, on November 4, 2022, Infegy Atlas Query Alert below showed a 102.83% increase in post volume related to Kherson, with a 37.42% increase in positive sentiment. The Ukrainians retook the city just days later.

Figure 5: Infegy Atlas Query Alert showing increase in sentiment and post volume prior to Ukrainian forces retaking the port city of Kherson; Infegy Atlas data.
Conclusion
This brief looked at how conflict-zone analysts can use Infegy Atlas to monitor the momentum associated with the Ukrainian-Russian War.
We showed you how post volume can be used as a proxy for global events. Next, we looked at how Infegy Atlas’ Entity detection equips analysts to monitor how weapons are deployed in Ukrainian cities and how Russian war leaders are portrayed on social media.
Finally, we used Infegy Atlas’ Query Alerts to show how analysts can get real time updates on how the battlefield has changed. While Infegy Atlas is most commonly used for its market and consumer intelligence, the its flexibility as a research and data tool lends itself well to unusual and unique use cases, particularly when the immediacy of data is a priority.
Monitoring War Zones with Social Media Intelligence
Explore how Infegy Atlas utilizes social media intelligence to provide real-time insights into conflict zones, offering a unique perspective on war dynamics.
Real-time Insights on the Russian-Ukrainian War
Infegy Atlas analyzes social media posts to offer real-time data on the Russian-Ukrainian War, marking it as the first “TikTok viral” war.
Post Volume as a Conflict Momentum Indicator
Infegy Atlas uses post volume to gauge public interest and track conflict momentum in regions like Kherson and Izyum, offering valuable insights for analysts.
Entity Detection for Weapons and Leadership Analysis
Discover how Infegy Atlas' entity detection identifies key weapons and Russian leaders in conflict zones, enhancing social media analysis capabilities.
Query Alerts for Immediate Conflict Updates
Stay informed with Infegy Atlas' Query Alerts, providing analysts with instant updates on changing conditions in conflict zones like Kherson.


.png?width=64&height=64&name=linkedin%20(1).png)