Share this
by Hephzibah Dutt on June 7, 2023
Mass lay-offs have become their own sort of contagion this year and DEI teams are among the first to get slashed. According to Factorial, global industry leaders like Twitter, Amazon, Meta, and Microsoft are the most notable companies announcing cuts.
This is disheartening for several reasons and also sets an unfortunate precedent for smaller businesses. It also reinforces that employee-led advocacy will be especially critical to creating inclusive workplaces in the years to come!
Social media has stood witness to the many times employees have stepped up as catalysts for change and leveraged their experiences – and social media platforms – to advocate for a more equitable and inclusive work environment. So, rather than give in to skepticism and disappointment over the disturbing cutbacks to corporate DEI commitments, we revved up Infegy Atlas to see what social media data has to say about employees shaping the journey to diverse, equitable, and inclusive workplaces.
Here, we used our social listening tool, Infegy Atlas, to dive into the employee-led Google Walkout and also examine the rise and social media intelligence around employee resource groups (ERGs)!

Figure 1: Topics word cloud for “Google Walkout,” colorized by sentiment; Infegy Atlas Data.
Social media revelations about the Google Walkout
“We’ve waited for leadership to fix these problems, but have come to this conclusion: no one is going to do it for us. So we are here, standing together, protecting and supporting each other.”
The quote above is from a written statement from the organizers of the 2018 Google Walkout. It’s followed by a list of employee demands – an end to “the sexual harassment, discrimination, and the systemic racism that fuel this destructive culture.”
Few incidents from the past 10 years scream “employee-led action” as much as the Google Walkout of 2018. Over 20,000 Google employees across the globe walked out from their offices at approximately 11 am in their time zone to protest how Google handled sexual harassment allegations. It was triggered by a New York Times report that revealed Google had paid multi-million dollar severance packages to executives accused of sexual misconduct instead of addressing their behavior and making reparations to the victims.
Let’s dive into the social media insights!
Infegy text analysis: Topics and hashtags
Topics in the conversation around “Google Walkout” provide an excellent summary of the entire incident (Figure 1). Given that the conversation revolved around outrage and reaction to sexual misconduct, sexual harassment, and a lack of transparency, it is no wonder that the sentiment across most of the topics tilt toward negative. However, in terms of the frequency of what people discuss, frequency of mentions show that Google employees and their demands remained central to the conversation.
Even more significantly, hashtag analysis of the conversation reveals that the Google Walkout went well beyond Google to participate in a larger conversation about inclusion, safety, gender discrimination, and sexual harassment in workplaces (Figure 3). We see this in the frequency of #MeToo, #TimesUp, #EndForcedArbritration, and #WomenInTech in the conversation.

Figure 2: Hashtags in the conversation around “Google Walkout”; Infegy Atlas data.
Related: See how we used text and sentiment analysis to track parents’ growing interest in flip phones (Insight Brief).
Infegy geographic data analysis
Infegy Atlas social media data analysis also speaks to the international nature of the walkout. Returning to the Topics word cloud (Figure 1), we found that it includes major cities that participated in the walkout - Dublin, London, Singapore, and San Francisco. However, Infegy Atlas’ geographic distribution data also reveals which countries contributed to social media conversation and to what extent.
In terms of the number of posts and other social media documents, the United States’ contribution was the highest, followed by the UK, Canada, and India (Figure 3).

Figure 3: Geographic distribution ordered by number of documents (2018 -2023); Infegy Atlas data.
However, a more accurate metric to look at here might be Geographic Distribution Score. Scores factors in the population of a particular country, the number of sources providing the documents/posts, and the number of people who have broadband access in that country. By this metric, Ireland seems to be the country that was most engaged in the conversation, with a score of 100, followed by the USA, Switzerland, and the United Arab Emirates (Figure 4)!

Figure 4: Geographic distribution of conversation around “Google Walkout,” colorized by Infegy Score; Infegy Atlas data.
Related: See how we used social media intelligence to track how defensive PR and damage control campaigns go wrong (Insight Brief).
Ultimately, the protest garnered significant media attention and led to some policy changes, such as the end of forced arbitration for sexual harassment claims. It highlighted the growing activism among tech workers and raised awareness about the need for safer and more inclusive work environments in the industry. It was also part of a growing conversation about women in tech.
We’ve seen a 356% growth of #WomenInTech over the past 10 years, with the highest number of mentions – over five million – occurring in 2018 (Figure 5)!

Figure 5: Post volume for “#WomeninTech” (2013-2023); Infegy Atlas data.
Social intelligence data on employee resource groups (ERGs)
ERGs bring together employees with shared backgrounds, interests, or experiences. They're like mini-communities within a company where people can connect, support each other, and enjoy communal activities. ERGs also focus on a variety of things like diversity, inclusion, gender equality, LGBTQ+ rights, and more. When it comes to DEI, active ERGs organize events, workshops, and initiatives to promote awareness, understanding, and positive change.
Social data reflects how the presence and activity of ERGs within the workplace have grown massively in the past 10 years. Reflected in social media analytics, prior to 2013, ERGs were practically non-existent (Figure 6)!

Figure 6: Post volume for “employee resource group” (2013-2023); Infegy Atlas data.
Social listening reveals that ERGs are truly diverse, creating support and community for all kinds of groups, not just the “hot topic” issues that corporations tend to virtue-signal around (we’re talking about greenwashing, pinkwashing, and reneging on DEI commitments). For example, #VeteransDay and #AAPIHeritageMonth emerge in the analysis, indicating a significant degree of mentions (Figure 6). #Belonging, #inclusivity, and #community signify that ERGs contribute to the work and conversations about workplace inclusivity, and creating a sense of belonging.

Figure 7: Hashtags in the ERG conversation (2013-2023); Infegy Atlas data.

Figure 8: Emotions analysis of the ERG conversation (2013-2023); Infegy Atlas data.
Emotions analysis of the conversation shows impressively high Love and Trust metrics: 25% of ERG-related posts convey emotions of love, and 22% of posts convey trust! It’s notable that Anger metrics are low in these conversations.
Related: See more of our Emotion metrics at work in our Top 20 Most Trusted Brands (blog) and get the free Infegy’s Most Trusted Brands 2022 dashboard.
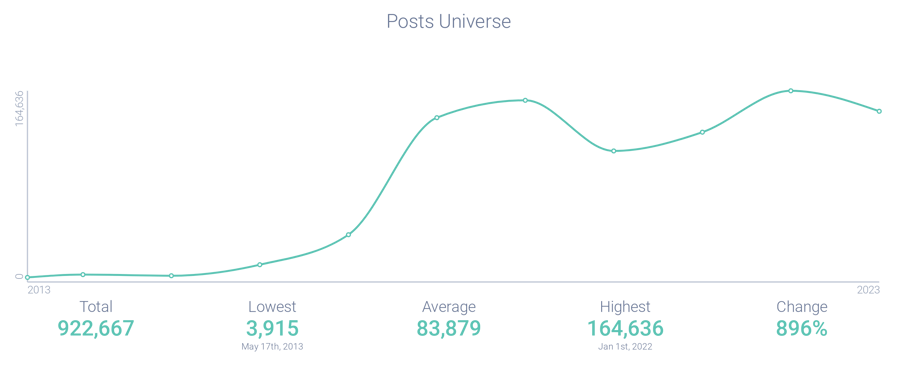
Figure 9: Post volume for “inclusive workplace” (2013-2023); Infegy Atlas data.
Quantitative social listening data for complex, qualitative insights
Working towards inclusive workplaces is not a fading trend. Social listening data shows a massive 896% growth in the conversation around “inclusive workplace” over the past 10 years (Figure 9). It is notable that this uptrend began well before the mass corporate commitments to DEI in 2020, with the highest number of posts occurring in Jan. 2022. You can learn more about that and see ten years of social media intelligence into DEI journeys here.
Whether Big Industry leaders reinstate their commitment to the diversity programs they began three years ago or not, the social listening data has us hopeful … and watching how employee-led action will keep the DEI journey going.
If your work needs data and consumer insights that traditional market research can’t easily quantify, we’d love to hear from you. Reach out for a demo today!
Key Takeaways
1.Employee activism is filling the DEI leadership void: As major companies cut DEI teams, employees are increasingly taking matters into their own hands to drive workplace inclusion. The 2018 Google Walkout, where over 20,000 employees protested sexual harassment policies, demonstrates how grassroots employee action can force meaningful policy changes like ending forced arbitration.
2.Employee Resource Groups (ERGs) have exploded in growth and impact: Social media data shows ERGs were nearly non-existent before 2013 but have grown massively over the past decade. These groups create authentic community and support across diverse employee populations, with 25% of ERG-related posts conveying love and 22% conveying trust—suggesting they genuinely foster workplace belonging.
3.The momentum toward inclusive workplaces continues despite corporate cutbacks: Interest in "inclusive workplace" has grown 896% over the past 10 years, with the uptrend beginning well before 2020's corporate DEI commitments. This suggests the push for workplace equity is driven by genuine grassroots demand rather than temporary corporate trends, and will likely persist through employee-led efforts even as companies scale back official programs.


.png?width=64&height=64&name=linkedin%20(1).png)